Read agency sales
Sales in the Admin portal shows your whole agency's sales or commissions for a year, by agent or by product, compared with the year before. Expand a row for its monthly chart, then drill in.
What you can switch
| Control | Options | Default |
|---|---|---|
| Measure | Sales or Commissions | Sales |
| Date | Book Date or Checkout | Book Date |
| Year | Any year with data | This year |
| Currency | USD, EUR or MXN, with optional conversion rates | USD |
| Status | Active, Completed, Cancelled | Active and Completed |
| Include | Customer travel, Personal travel, Agency travel, Commissionable, Non-commissionable | All |
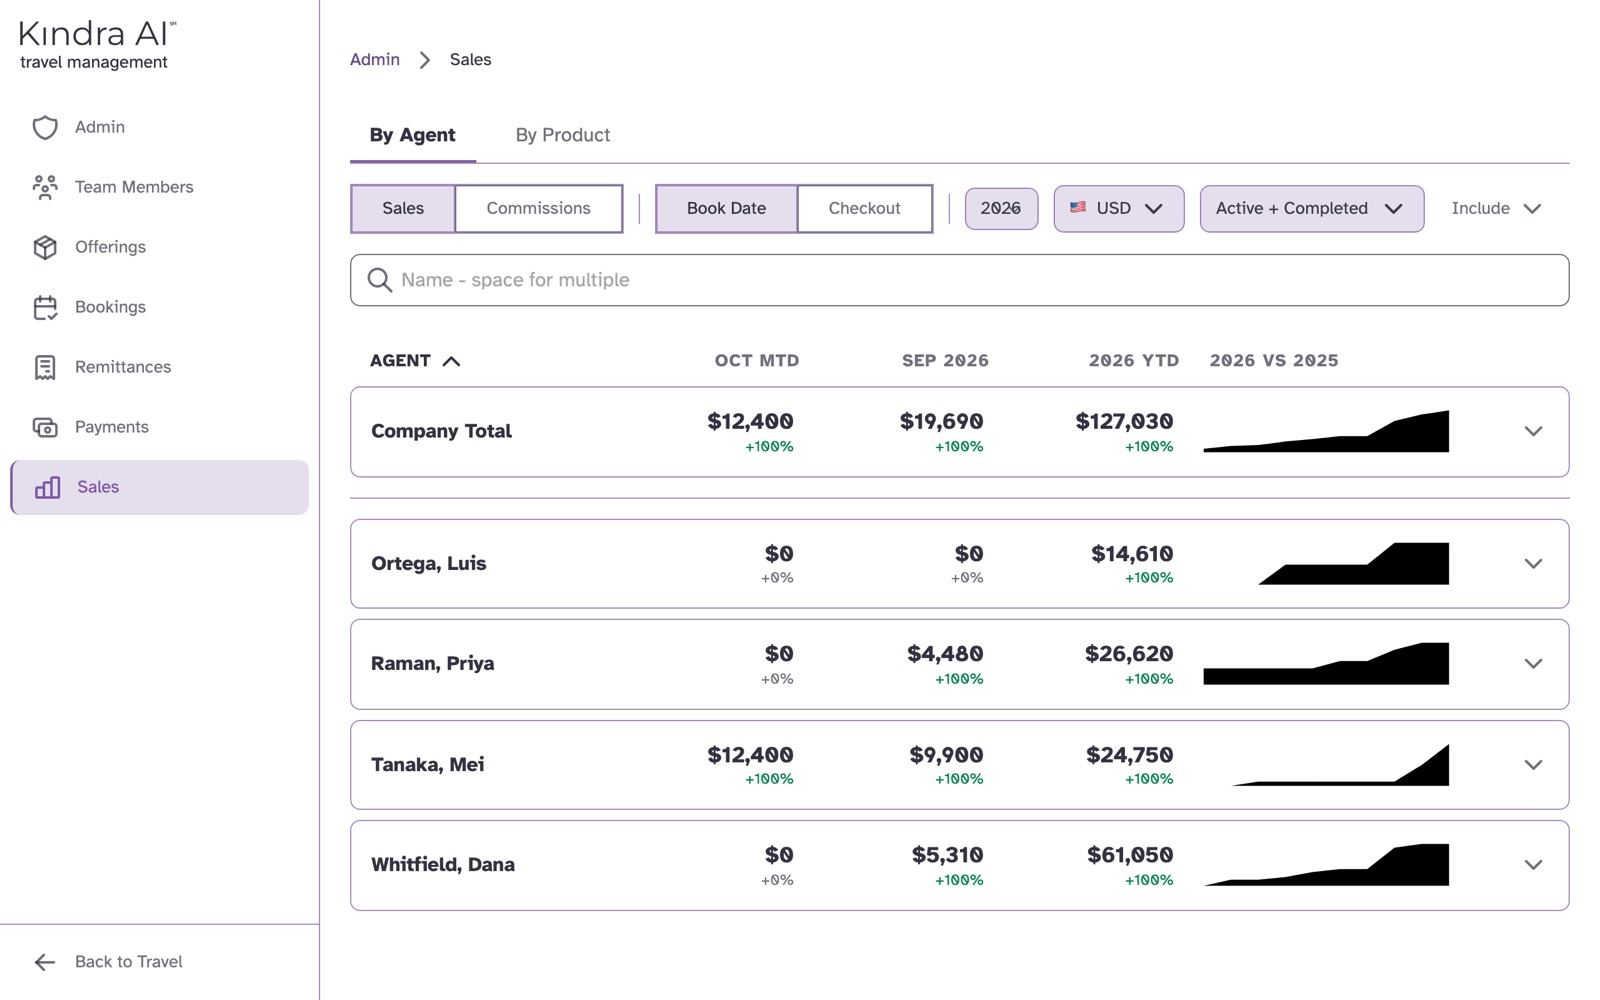
How it is grouped
Start By Agent or By Product. The first row is Company Total.
Expand a row to see its monthly chart, then drill in:
| You are looking at | You can drill into |
|---|---|
| An agent | Their products, destinations and properties |
| A product | Its agents and destinations |
| A destination | Its agents and properties |
| A property | Its agents |
The breadcrumb at the top shows where you are. Select Sales in it to start over.
The columns
| Measure | Columns |
|---|---|
| Sales | This month to date, last month, and the year to date |
| Commissions | Agency, Agent and Gross |
| Both | This year compared with the year before |
Select a column heading to sort by it.
One team member's sales
Select Team Members, open the person, and select their Sales tab. It shows their monthly sales for a year, by Book Date or Checkout. Select a month to list its reservations.
If something goes wrong
"No sales data" with "Try adjusting your filters"
Nothing matches the year, currency, status and Include choices. Check the currency first, then the status.
An agent shows zero
For the current year, By Agent lists every active team member, including those with no sales yet.
Still stuck?
Email support@kindra.ai and tell us which screen you were on and any message you saw.